A very interesting new feature announced in preview a few days ago is the integration of Purview IRM results with ENTRA conditional access.
Remembering Insider Risk Management
Purview IRM is a feature of Defender XDR to monitor activity across your organization at the individual and enterprise level.
It allows you to compare a user’s behavior in relation to your own traditional behavior or the behavior of the corporation as a whole and detect anomalies. For example, it is capable of detecting when an employee has sent a number of emails or copied files in a different curve than what they usually do on a daily basis. This behavior indicates that the user is exfiltrating data, whether internal or external.
For those who don’t know it, I discussed this feature at the 2022 Ignite After Party ( Marcelo Sincic | Avoiding data leaks with Microsoft Purview in pt-br ).
Integrating with Conditional Access
In this preview we can now use IRM metrics to detect and block a user who is exhibiting abnormal behavior.
This new feature will dynamically avoid two risk situations:
- A user who is leaking or copying data continues to log into systems and services such as OneDrive, SharePoint and others will be blocked after their alert level reaches what you determine
- A hacker or malicious actor is copying data to another location posing as a legitimate user who may have had credentials stolen
Configuring this integration is very simple, indicate this new access condition and the desired level of sensitivity:

Conclusion
Now you can take automatic and reactive action when anomaly is detected in a user’s behavior in IRM.
Technical reference: Help dynamically mitigate risks with adaptive protection (preview) | Microsoft Learn
We always look and care about whether we are really protected against the most common and sophisticated attacks.
MITER has a very interesting tool with attack kits, which is AttackIQ Flex, available at https://www.attackiq.com/
What is AttackIQ Flex
A set of tools to simulate attacks with several attack simulations separated by groups, where you can follow the instructions.
The trial packages are separated into those that are free and those that are paid for with credits that can be purchased within the tool itself.


These tools are important since Microsoft no longer has the native Attack Simulator feature in the suite ( Microsoft Defender for Endpoint evaluation lab | Microsoft Learn )
Example: EDR Test Package
When downloading the EDR package, simply run the content and 27 different attacks will be simulated, such as CryptoInject, Petya, WannaCrypt, Diamond and others.
Run the script that will execute each of the 27 simulated attacks step by step. Remembering that these are simulators that do not encrypt or actually carry out the attack, but rather generate the signals that EDRs should natively identify to prevent the attack from being carried out:

The EDR should instantly alert the user that attacks have been blocked, files sent to quarantine or reported:

Once completed, a zip file will be generated with the test results, which must be uploaded to the AttackIQ Flex website, which will generate a very detailed executive report:


Defender for Endpoint EDR Protection Result
And how did Defender for Endpoint, Microsoft’s EDR solution, fare in testing?
VERY WELL, THANK YOU!!!!!
It detected all 27 attacks with a 100% rating, generated alerts and a single aggregated incident for the station attacked in the simulation and the integration with Sentinel detailed the actions.

As mentioned, Defender was able to identify that the point of attack suffered a sequence of attacks and generated 27 alerts and a single incident:

And as I have my environment integrated, Sentinel received all alerts to be handled by the SOC with details of the entities involved in decision-making:

Conclusion
Defender for Endpoint did very well, as expected.
The AttackIQ Flex toolkit proved to be efficient and comprehensive with an extensive catalog of categories and different simulators.
The workbook has now been made public (as of the date written in public preview) I tested it when it was in Private Preview for two months.
This workbook allows you to create connectors for data that are not standardized and consequently do not appear in the Sentinel data panel, although it is possible to create anomaly and hunting rules from Azure Monitor DCRs (Data Collection Rules).
Advantages of Custom Collectors
In addition to the visual feature in Sentinel of seeing your collector and statistics, you will have integration with external APIs.
This integration will allow you to simply capture data from external sources such as third-party PaaS and SaaS products.
The Workbook
The workbook is not so simple that it can be used by a professional who does not know Azure Monitor and logging concepts (JSON, CSV, Endpoint, API URL/Authentication, etc.) well. But for those who already use DCRs today and capture data in Log Analytics, it will be simpler.
After downloading the workbook through Content, you will see that it allows you to indicate the subscription, log analytics, endpoint and visually define the characteristics of the data you want to collect:


Reference
Create Codeless Connectors with the Codeless Connector Builder (Preview) – Microsoft Community Hub
Within Purview’s suite of data protection solutions for customers with the M365 E5 package (addon or O365) it is possible to use the DLP Endpoint feature where the DLP and label rules also apply to files recorded on the local machine or transmitted via external websites.
Enabling and Configuration
These settings are located in Settings and cover several parameters where we want to apply information protection policies:

Once we have defined the types of blocking that we want to implement, we define that a certain policy is also applied to the devices:

Discovering the Application of Policies
Until then, many already use the resource. But how do you know if the policies were applied to a given machine?
To do this, it is possible to use PowerShell, however an application developed by the Microsoft team allows viewing in a simple way and is available in Troubleshoot and Manage Microsoft Purview Data Loss Prevention for your Endpoint Devices – Microsoft Community Hub with the name DisplayDlpPolicy.exe .
This application is very simple to use and will allow you to see at a station which policy was applied in detail.
The first example below shows which DLP policies are applied to the device:

The second command below exemplifies the DLP Endpoint Settings :

This result above is especially important to find out if a given failure was caused by a detection problem or if the rule is not applied, as here we see in detail which protections were configured.
Available in preview through the CCP program a few months ago and now available to all users (GA), the Tasks feature in Sentinel is an important and expected feature ( Use tasks to manage incidents in Microsoft Sentinel | Microsoft Learn ).
Why it is an important resource
The commenting feature had already been introduced in the sentinel some time ago, but it did not allow control of what needed to be done in a sequence and served each operator or analyst to report what was done or discovered.
The tasks feature allows analysts and SOC operators to indicate a sequence, well-defined steps and are clearly identified.
The screen below demonstrates how simple and useful this is.

See that I already have a standard task via automation that I will cover later, but I have already created an example task and adding tasks is simple, allowing editing with bullets or numbered lists.
Tasks cannot be assigned to third parties, as the analyst responsible for triage will direct the incident to another operator or specialist analyst who will lead the investigation.
Automating Tasks
In the example I used, see that the first task was created by automation that includes the name of the person responsible and creates a basic task just as an example.

This is done in Sentinel under Automations with all incidents that are generated in my demo environment:

Typical question: But each incident has standardized tasks, for example DLP validating the content and owner of the information according to the ABC policy and so on.
Answer: In my example I do not use filters, but you can use the “Analytic rule name” condition to indicate which types of incidents the automation flow will apply to and thus include specific tasks for a given incident. In my environment I have a standard automation that is the one above and another automation for specific analytical rules such as IOC indicators where I insert tasks when that incident happens.
Conclusion
With this resource it is now possible to have a clear indication of how to handle the incident in an organized way and visually validate the steps already taken and what is pending.
This will help a lot in resolving and monitoring incidents, especially those that take a considerable amount of time or have a series of concomitant tasks throughout the analysis.
I have already commented in past posts about MDTI (Microsoft Defender for Threat Intelligence) when integrated with Sentinel to detect indicators of attack or compromise with KQL (https://msincic.wordpress.com/2023/09/03/utilizing-microsoft-defender-threat-intelligence-iocs-in-sentinel/).
This time we are going to introduce a new tool which is EASM (Defender External Attack Surface Management) where by indicating a “seed” which can be domain names, host IPs or DNS it searches for indicators of possible attack.
It is comprehensive in that it not only looks at the Threat Indicators based on the MDTI, but also includes in the analysis expired certificates, exposed CVEs, OWASP techniques, security posture in configurations and adherence to GDPR.
Best of all: EASM IS FREE FOR THE FIRST 30 DAYS!
Enabling and Initial Configuration
The process is very simple, it follows step by step:
- Create the resource in Azure, where you will enter subscription, resource group and tags basically
- Enter the settings in “Discovery” and create the search root (or seed) with the “Discovery Group”
- In the search settings, indicate the frequency and what you want to search for.
Here is an interesting point, where well-known companies and organizations can be pre-loaded in the “Import…” option, which are companies already known on common internet bases - Remember to place exclusions if you have honeypot servers to avoid generating unnecessary alerts

Now just wait 48 to 72 hours for the discovery to generate the data.
Analyzing the generated data
In Overview it is now possible to detect the different items that need to be observed in the form of tabbed lists. In this list I already detect suspicious IPs for being used in malware distribution on the MDTI basis.
Looking there, we discovered an old IP that I used on a server that is now an indicator of attack:

Here you can see a summary and an indication that one of the IPs is suspicious:

EASM itself already carries information indicating which type of attack this IP is subject to and is registered with MDTI:

Opening the host observation tabs we can see what this host hosts, certificates, reputation and all the details:

I also already have a view of all the certificates used on the host for the different domains, which allows me to detect internal and external certificates that are expired or close to expiring:

In this example, I discovered later by investigating that one of the domains hosted on the same server had vulnerabilities and was being used to distribute a video website.
I changed the host and removed the DNS record pointing to this host, which was actually just an old verify record and was no longer active.
Conclusion
Using EASM we can monitor our resources that are exposed on the internet and thus protect ourselves and our customers!
It’s been a few years since Microsoft acquired RiskIQ and recently released Microsoft Defender for Threat Intel (MDTI).
What is MDTI?
I’ve already discussed a few times about IoCs, or indicators of compromise in English, and how they can be integrated, as in the case of VirusTotal ( Marcelo Sincic | Enriching Sentinel with data from Virus Total ).
In this post, we are going to talk about the MDTI solution and how to integrate its base with Senitnel and use it for hunting and analysis of incidents and alerts in your environment.
First, it is important to know that the MDTI service is paid per user in a contract licensing model, but the database can be imported into Sentinel through a connector.
Connecting Sentinel to MDTI Base
For this you will need to install the Microsoft Defender for Threat Intel solution on Sentinel from Content Hub and then configure the Data Connector as below:

Once configured, MDTI data will be ingested daily into Sentinel’s Threat Intelligence base:

It is important to remember that MDTI ingested IoCs will be added to custom IoCs or imported from other bases that you have configured.
Configuring Log integrations with TIs
After installing the solution and configuring the data connector, the next step is to configure and install the data crossing rules using Sentinel Analytics .
There are several different rules that you can use that are already ready:

These rules are composed of KQL queries that analyze an alert and incident to cross-check with the base of imported IoCs, resulting in data enrichment when validating that a certain IP or malicious URL was accessed or tried to access your environment.
Of course, this can be done manually, it would be enough to run a manual or custom KQL query in Sentinel in hunting queries to cross IPs and URLs with the different existing Sentinel logs. An example of this was a recent client where we discussed crossing Umbrella DNS logging with MDTI to detect malicious websites accessed by users.
Visualizing incidents with MDTI data
Now comes the practical part. Once configured, you will have new alerts and incidents in your environment:

Let’s open the details of the first one and see the IP that indicates a potential attack:

Since in the incident itself I already know that the IP is considered suspicious, we can investigate the details imported into the base to view the details:

And finally, I will use the MDTI interface to query the IP data, remembering that in this case I need to have an MDTI license to see the details:

Let’s now do the same process with the second example incident I have on my list and open the details in MDTI:


Conclusion
The Microsoft Defender for Intel Threat (MDTI) service will help you detect various forms of attacks coming from professional or previously identified offenders and groups.
In addition, its base is rich in details of the type of attack, targets and groups that work with that specific IoC that was used to try to access its environment.
It may seem like unnecessary protection, but protecting the WAF log is an important item in preserving personal (PII) or even corporate data of your customers and partners.
Scenario
As your site needs to receive login data (whether customers, partners or suppliers) in POST or JSON calls with username and password, you may experience a leak if the log falls into the hands of a malicious agent that can be an employee or external.
An example I had a few years ago was in a credit consultation system integrated with registration partners such as Experian and Commercial Associations. The system’s error log stored calls with errors in plain text format in the database so that developers and Customer Service could find errors in queries returned.
However, in this log many times the problem was an error in the password and username sent and with that it would be enough to use logic to deduce that the user wrote a letter or typed too many or different to get to know his password. And even worse, in the complete authentication service log it was possible to see the data sent to the client in the GET.
That is, if a partner consults my ID or someone I’m interested in, I could look in the log for the return that was sent on the performance of this person’s credit services without it being logged anywhere since I accessed the log directly.
Now in Azure we can leave this in the past since we no longer need to keep programmatic logs since it stores everything in Log Analytics. But we still have a log where any security operator can use a KQL and see the data, even use a valid user to query data in the system.
Solution
At the time we noticed this problem, the solution had to be manual, programmatically removing the recording of the log for user and password in the functions, in addition to masking Personal and Customer ID. But obviously this was not a definitive solution, as the WAF and IIS log would still hold the raw data.
Now in Azure WAF it is possible to create masking rules for the log, that is, I will be able to identify the data in JSON and POST that I need to protect and prohibit from being used in KQL queries.
Settings
In WAF policy properties use “Sensitive Data” menu to access log scrubbing like my setup below:
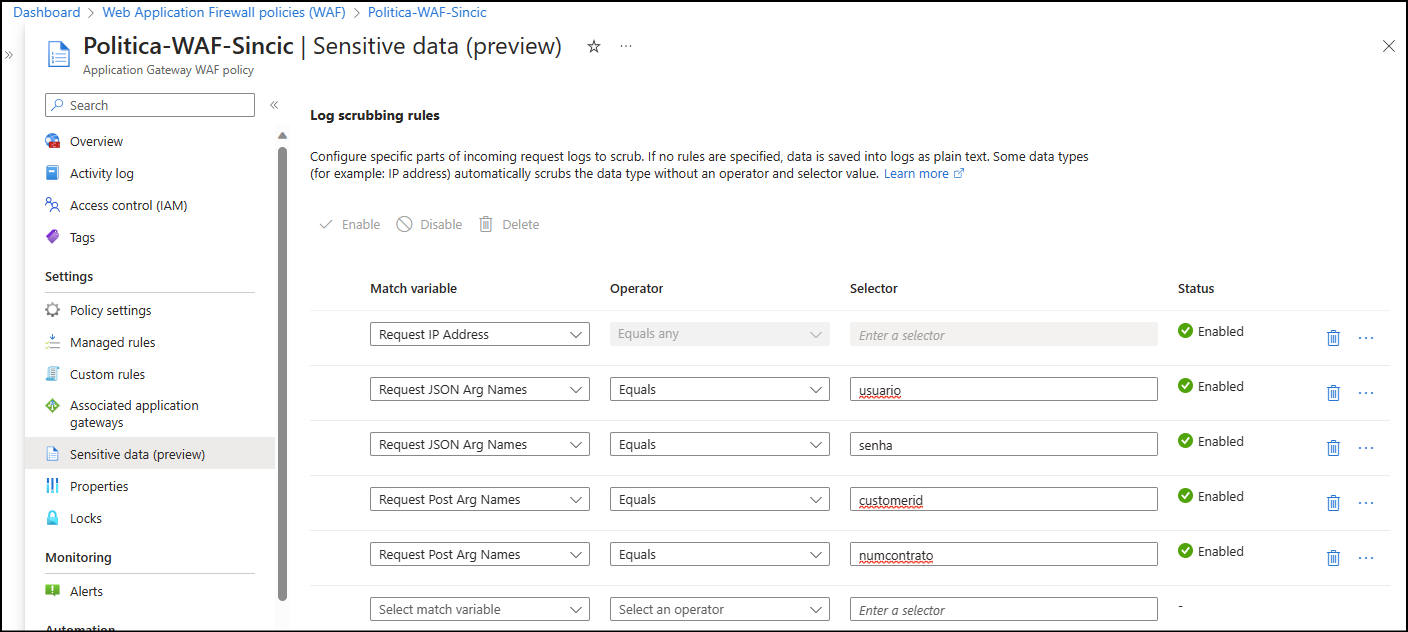
In my example I used the parameters and variables that are used by my developers to identify user, password, contract number and customer ID.
Here you could add ID or other documents that are received and sent arguments. Below is the list of variable types that can currently be masked:
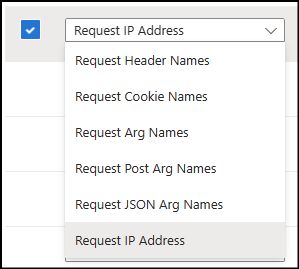
Except for the IP Address, all other types allow the option “Equal” and “Equal any”, where the first allows indicating named information and the second masks whatever the content of the selected item is. In the case of “Equal any” it is important to remember that it will encrypt all variables of that format, which could be bad for future debugging.
Reference
Microsoft has already released the documentation for the feature on Learn, so use the Azure WAF – Masking Sensitive Data – Microsoft Community Hub announcement
In a previous post I discussed the use of the Application Insights Log to view attacks and anomalies https://msincic.wordpress.com/2021/09/08/using-azure-application-insigths-in-vulnerability-analysis/
However, I saw the need to complement for some who asked me to integrate queries with MCAS logs, Defender and others.
Assuming that in all tools we will use KQL (Kusto Query Language) the first step is to write the command for this and bring the log like the image below:

In the query above, it is possible to bring the data that are in the dashboard of the previous article, but because it is written in KQL, you can customize the columns, formats and filters what interests you best.
For example, you can alter the original query to bring the IPs by countries that consulted the pages of your site the most to detect origins that you want to filter and block on the firewall:
AppRequests
| where TimeGenerated > ago(1d)
| where Success == False
| summarize count() by ClientIP, ClientCountryOrRegion

Another example is to filter requests that tried to download zipped files directly from your website, like the example below:
AppRequests
| where TimeGenerated > ago(1d)
| where Success == False
| where Url contains “zip” or Url contains “rar”
| project ClientCountryOrRegion, ClientStateOrProvince, ClientCity, ClientIP, Url

A third example is that I can identify SQL Injection attempts from the basic commands used for this type of vulnerability exploitation:
AppRequests
| where TimeGenerated > ago(1d)
| where Success == False
| where Url contains “select” or Url contains “union”
| project Url, ClientCountryOrRegion, ClientStateOrProvince, ClientCity, ClientIP

Conclusion
With the use of your application’s stored logs, it will be possible to visualize the main attacks and how to defend yourself by improving your application and having activity monitoring.
Introducing Total Virus
The Virus Total website is a well-known service by the cybersecurity team for allowing you to track various IoCs (Indicators of Compromissed) such as file hash, IP, domain or URL based on a simple search.
Virus Total has a subscription modality where it is free and has limits for consultations, in order to avoid its use by bots or third-party systems.See the details below and note that we have our API Key here even though it is a free account:

Solution on Sentinel
Since we have the possibility to integrate Virus Total data with Sentinel alerts and incidents, the first action is to install the Solution:

When installing the solution, you will see the information screen on the left that includes 9 playbooks that will collect incident, alert, domain or file data to search and correlate Sentinel data with Virus Total.The next step is to click on
Automation –> Playbook templates and install the playbooks, for this you can filter by the word “total virus” and use the
Create Template button to open the playbook installation window in your environment:

On this screen you will see that it is not yet necessary to connect your API Key or Log Analytics, this will be done after the
deploy when it opens the Logic Apps design screen:

Note that when opening the Logic Apps tasks and sequence you will see that the Virus Total and LogAnalytics connection will have the warning symbol and the save button will not work until you fix the connections.For this, the first time you will need to click on
API Connections and inform the data of both Virus Total and Log Analaytics that will be used. Below is the example of connection with Virus Total:

In the next connectors you will no longer need to configure the connections, as it will allow you to use the connection already configured in previous playbooks, like the image below:

Remember that you will need to connect both the Virus Total and Log Analytics API (workspace ID and Key).Once configured, now after opening all the tasks and indicating the connections you will be able to save the Logic Apps and you will see that it will appear in the
Active playbooks tab :

Creating the Automation
Now that we’ve imported the solution and created the playbooks we want to use, the next step is to create the rule to run it, called an
Automation Rule .To do so, click on the
Create button –
-> Automation Rule and indicate the name of the rule and the trigger (trigger), which can be a new incident, a changed incident or a new alert.
When choosing the type of trigger, use the Run Playbook action to choose one of the triggers we created in the previous step:


When creating the rule there are several forms of filters that you can use, for example to detect that there is a file that will be analyzed since one of the playbooks is specific for hashing. You can also filter only for certain types of incidents or alerts.
Conclusion
Integrating different services to have IoCs from different sources will help a lot in your incident analysis.Also being tested right now in private preview widgets to bring data from Anomali, Record Future and Virus Total when you are investigating an entity (Entity) but that is another post in the future 🙌
